
ESRI REST
Type of resources
Topics
Keywords
Contact for the resource
Provided by
Years
Formats
Representation types
Update frequencies
status
-
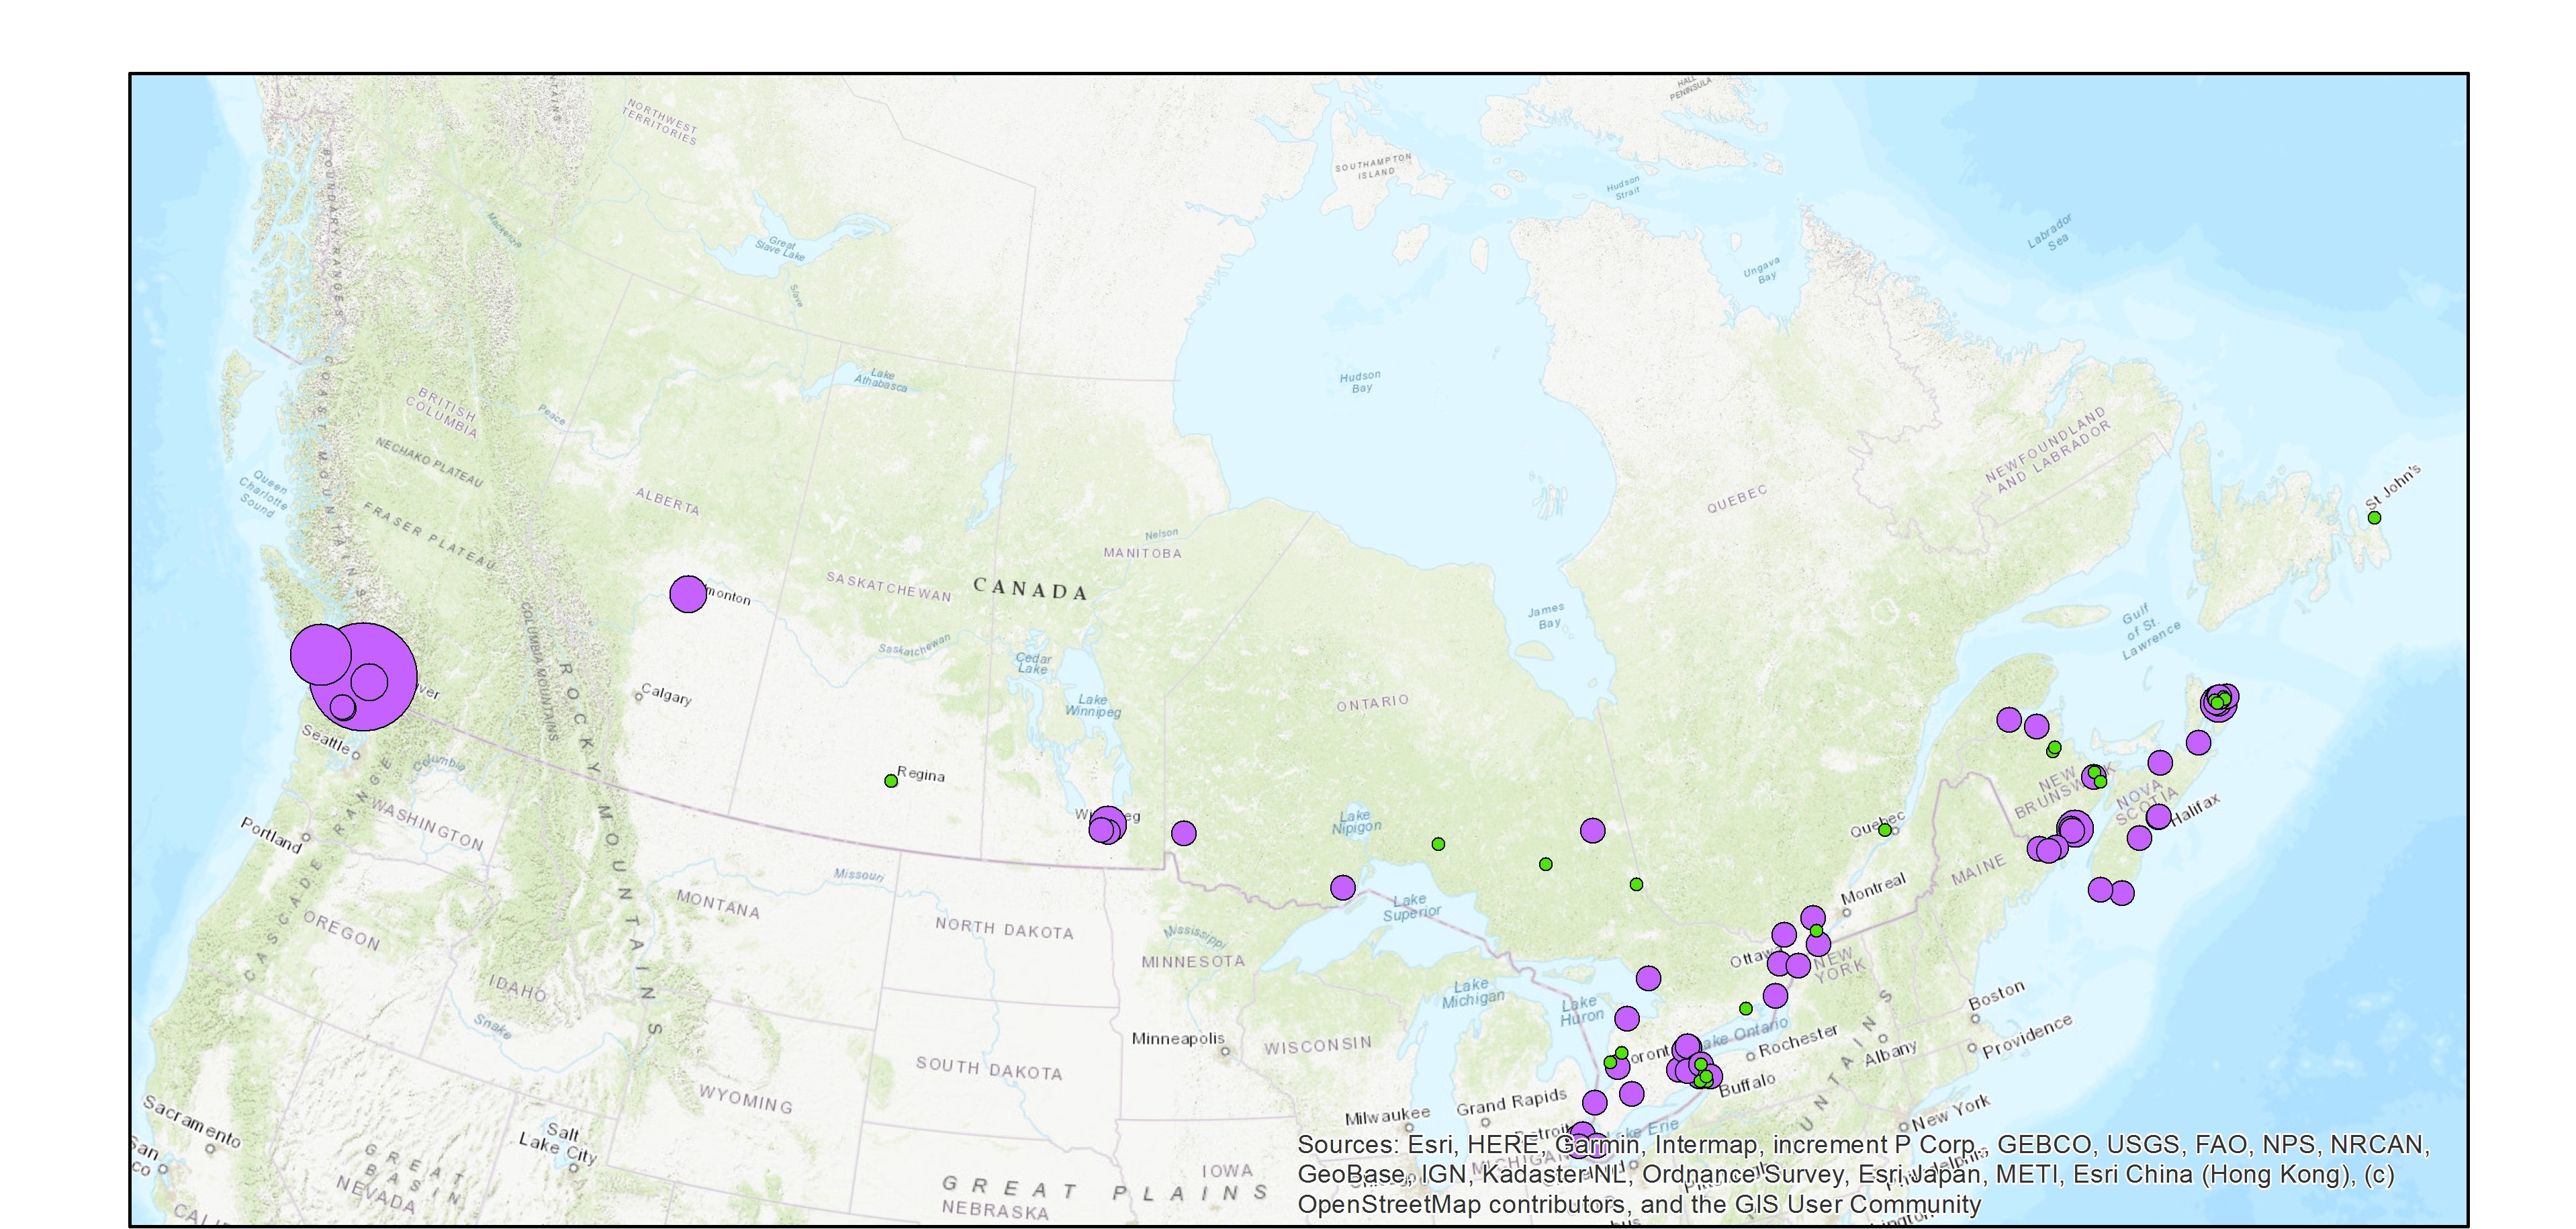
The Wastewater Systems Effluent Regulations (WSER), developed under the Fisheries Act, came into force in 2012 to manage wastewater releases by systems that collect an average daily influent volume of 100 cubic metres or more. The WSER also does not apply to any wastewater system located in the Northwest Territories, Nunavut and north of the 54th parallel in the provinces of Quebec and Newfoundland and Labrador. The WSER set national baseline effluent quality standards that are achievable through secondary wastewater treatment. The WSER require owners or operators of wastewater systems with combined sewers to submit an annual report on the total volume and the number of days wastewater is discharged per month via combined sewer overflow (CSO) points as a result of precipitation. The map below shows the volume of effluent (in cubic metres) discharged in a year from all CSO points situated within the collection area of a wastewater system. For the most part, the volumes provided to ECCC are estimates. Please note, a value of “999999999” in the dataset indicates that the volume data is unavailable and it does not mean that a volume of 999,999,999 m3 was released within the collection area of a wastewater system. The map is available in both ESRI REST (to use with ARC GIS) and WMS (open source) formats. For more information about the individual reporting wastewater systems, datasets are available in either CSV or XLS formats. Data from Quebec As of 2018, no combined sewer overflow volumes from Quebec municipalities are available since an equivalency agreement is now in effect. More information on the wastewater sector including the regulations, agreements, contacts and resource documents is available at: https://www.canada.ca/wastewater
-
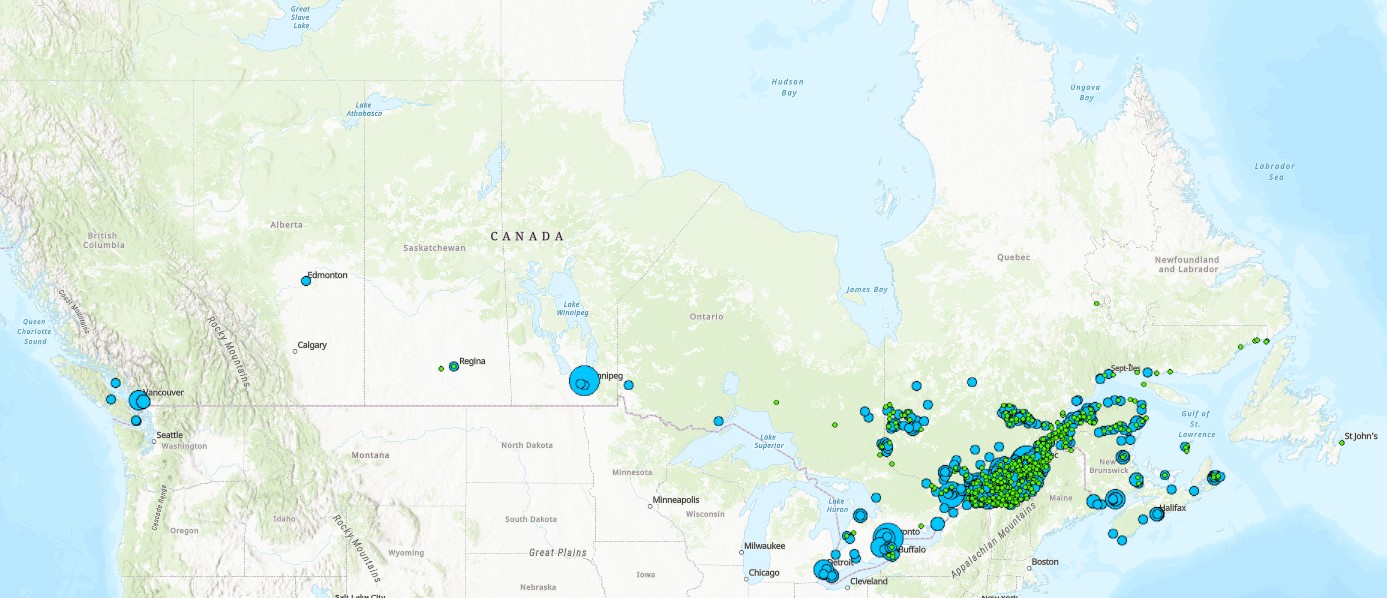
The Wastewater Systems Effluent Regulations (WSER), developed under the Fisheries Act, came into force in 2012 to manage wastewater releases by systems that collect an average daily influent volume of 100 cubic metres or more. The WSER also does not apply to any wastewater system located in the Northwest Territories, Nunavut and north of the 54th parallel in the provinces of Quebec and Newfoundland and Labrador. The WSER set national baseline effluent quality standards that are achievable through secondary wastewater treatment. The province of Quebec provided some combined sewer overflow data for 2020, which includes information on whether a discharge occurred at a combined sewer overflow point during the year. The map below shows the number of CSO points with at least one overflow event within each wastewater system. The map is available in both ESRI REST (to use with ARC GIS) and WMS (open source) formats. For more information about the individual reporting wastewater systems, datasets are available in either CSV or XLS formats. More information on the wastewater sector including the regulations, agreements, contacts and resource documents is available at: https://www.canada.ca/wastewater
-
Annual and five-year (5YA) average wet deposition maps for the non-sea-salt sulfate ion are available. The file formats include geodatabase files (*.gdb) compatible with geospatial software (e.g. ESRI ArcGIS) and KMZ files compatible with virtual globe software (e.g. Google Earth™). Maps can also be viewed online via Open Maps and the ArcGIS online viewer. Annual deposition from each site was screened for completeness using the following criteria: (1) precipitation amounts were recorded for >90% of the year and >60% of each quarter, and (2) sulfate concentrations were reported for >70% of the precipitation measured over the year and for >60% of each quarter. Five-year average wet deposition values are averaged annual deposition values with a completeness criterion >60% for the five-year period. Units for wet deposition fluxes are in kg of xSO4 per hectare per year (kg ha-1 y-1). Sources of measurement data and spatial interpolation method are described here: https://doi.org/10.18164/e8896575-1fb8-4e53-8acd-8579c3c055c2. Recommended citation: Environment and Climate Change Canada, [year published]. xSO4 Wet Deposition Maps. Air Quality Research Division, Environment and Climate Change Canada, Toronto, Ontario, Canada. [URL/DOI], accessed [date]. Recommended acknowledgement: The author(s) acknowledge Environment and Climate Change Canada for the provision of Canada-U.S. wet deposition kriging maps accessed from the Government of Canada Open Government Portal at open.canada.ca, and the data providers referenced therein.
-
The Wastewater Systems Effluent Regulations (WSER), developed under the Fisheries Act, came into force in 2012 to manage wastewater releases by systems that collect an average daily influent volume of 100 cubic metres or more. The WSER also does not apply to any wastewater system located in the Northwest Territories, Nunavut and north of the 54th parallel in the provinces of Quebec and Newfoundland and Labrador. The WSER set national baseline effluent quality standards that are achievable through secondary wastewater treatment. The map below presents data regarding compliance with the WSER effluent quality standards according to their averaging period. Wastewater systems must report on either a monthly, quarterly or annual basis. The dataset also includes the carbonaceous biochemical oxygen demand (CBOD) and suspended solids (SS) results for each wastewater system. Annual reporting: This map layer shows whether or not the wastewater systems met the WSER effluent quality limit according to an annual averaging period for carbonaceous biochemical oxygen demand CBOD or suspended solids SS. Quarterly reporting: This map layer shows whether or not the wastewater systems met the WSER effluent quality standards according to a quarterly averaging period. Note that a system that meets its CBOD limit or its SS limit for more than 75% of the time is considered to be in compliance with the effluent quality standards of the WSER. Monthly reporting: This map layer shows whether or not the wastewater systems met the WSER effluent quality standards according to a monthly averaging period. Note that a system that meets its CBOD limit or its SS limit for more than 75% of the time is considered to be in compliance with the effluent quality standards of the WSER. The map is available in both ESRI REST (to use with ARC GIS) and WMS (open source) formats. For more information about the individual reporting wastewater systems, datasets are available in either CSV or XLS formats. Data from Quebec and Yukon The data for Quebec municipalities (after 2017) is provided to the department separately through the equivalency agreement that was finalized in October 2018. Beginning in 2015, the data reported for the Yukon is provided to the department separately through an equivalency agreement finalized in 2014. More information on the wastewater sector including the regulations, agreements, contacts and resource documents is available at: https://www.canada.ca/wastewater
-
Patterns of wet deposition of the nitrate (NO3), non-sea-salt sulfate (xSO4) and ammonium (NH4) ions across areas of Canada and the United States are based on measurements of precipitation depth and ion concentrations in precipitation samples. xSO4 refers to the wet deposition of sulfate with the sea-salt sulfate contribution removed at coastal sites. These measurements were collected and quality controlled by their respective networks: in Canada, the federal Canadian Air and Precipitation Monitoring Network (CAPMoN) and provincial or territorial networks in Alberta, New Brunswick, the Northwest Territories, Nova Scotia, Ontario and Quebec. In the United States, wet deposition measurements were made by two coordinated networks: the National Atmospheric Deposition Program (NADP) / National Trends Network (NTN) and the NADP/Atmospheric Integrated Research Monitoring Network (AIRMoN). Only data from sites that were designated as regionally representative were used in the mapping. Wet deposition amounts were interpolated by ordinary kriging using ArcMap Geostatistical Analyst. The map is limited to the contiguous U.S. and southeastern or southern Canada because outside that region, the interpolation error exceeds 30% due to the larger distances between stations. Links to annual and five-year average maps are available in the associated resources.
-
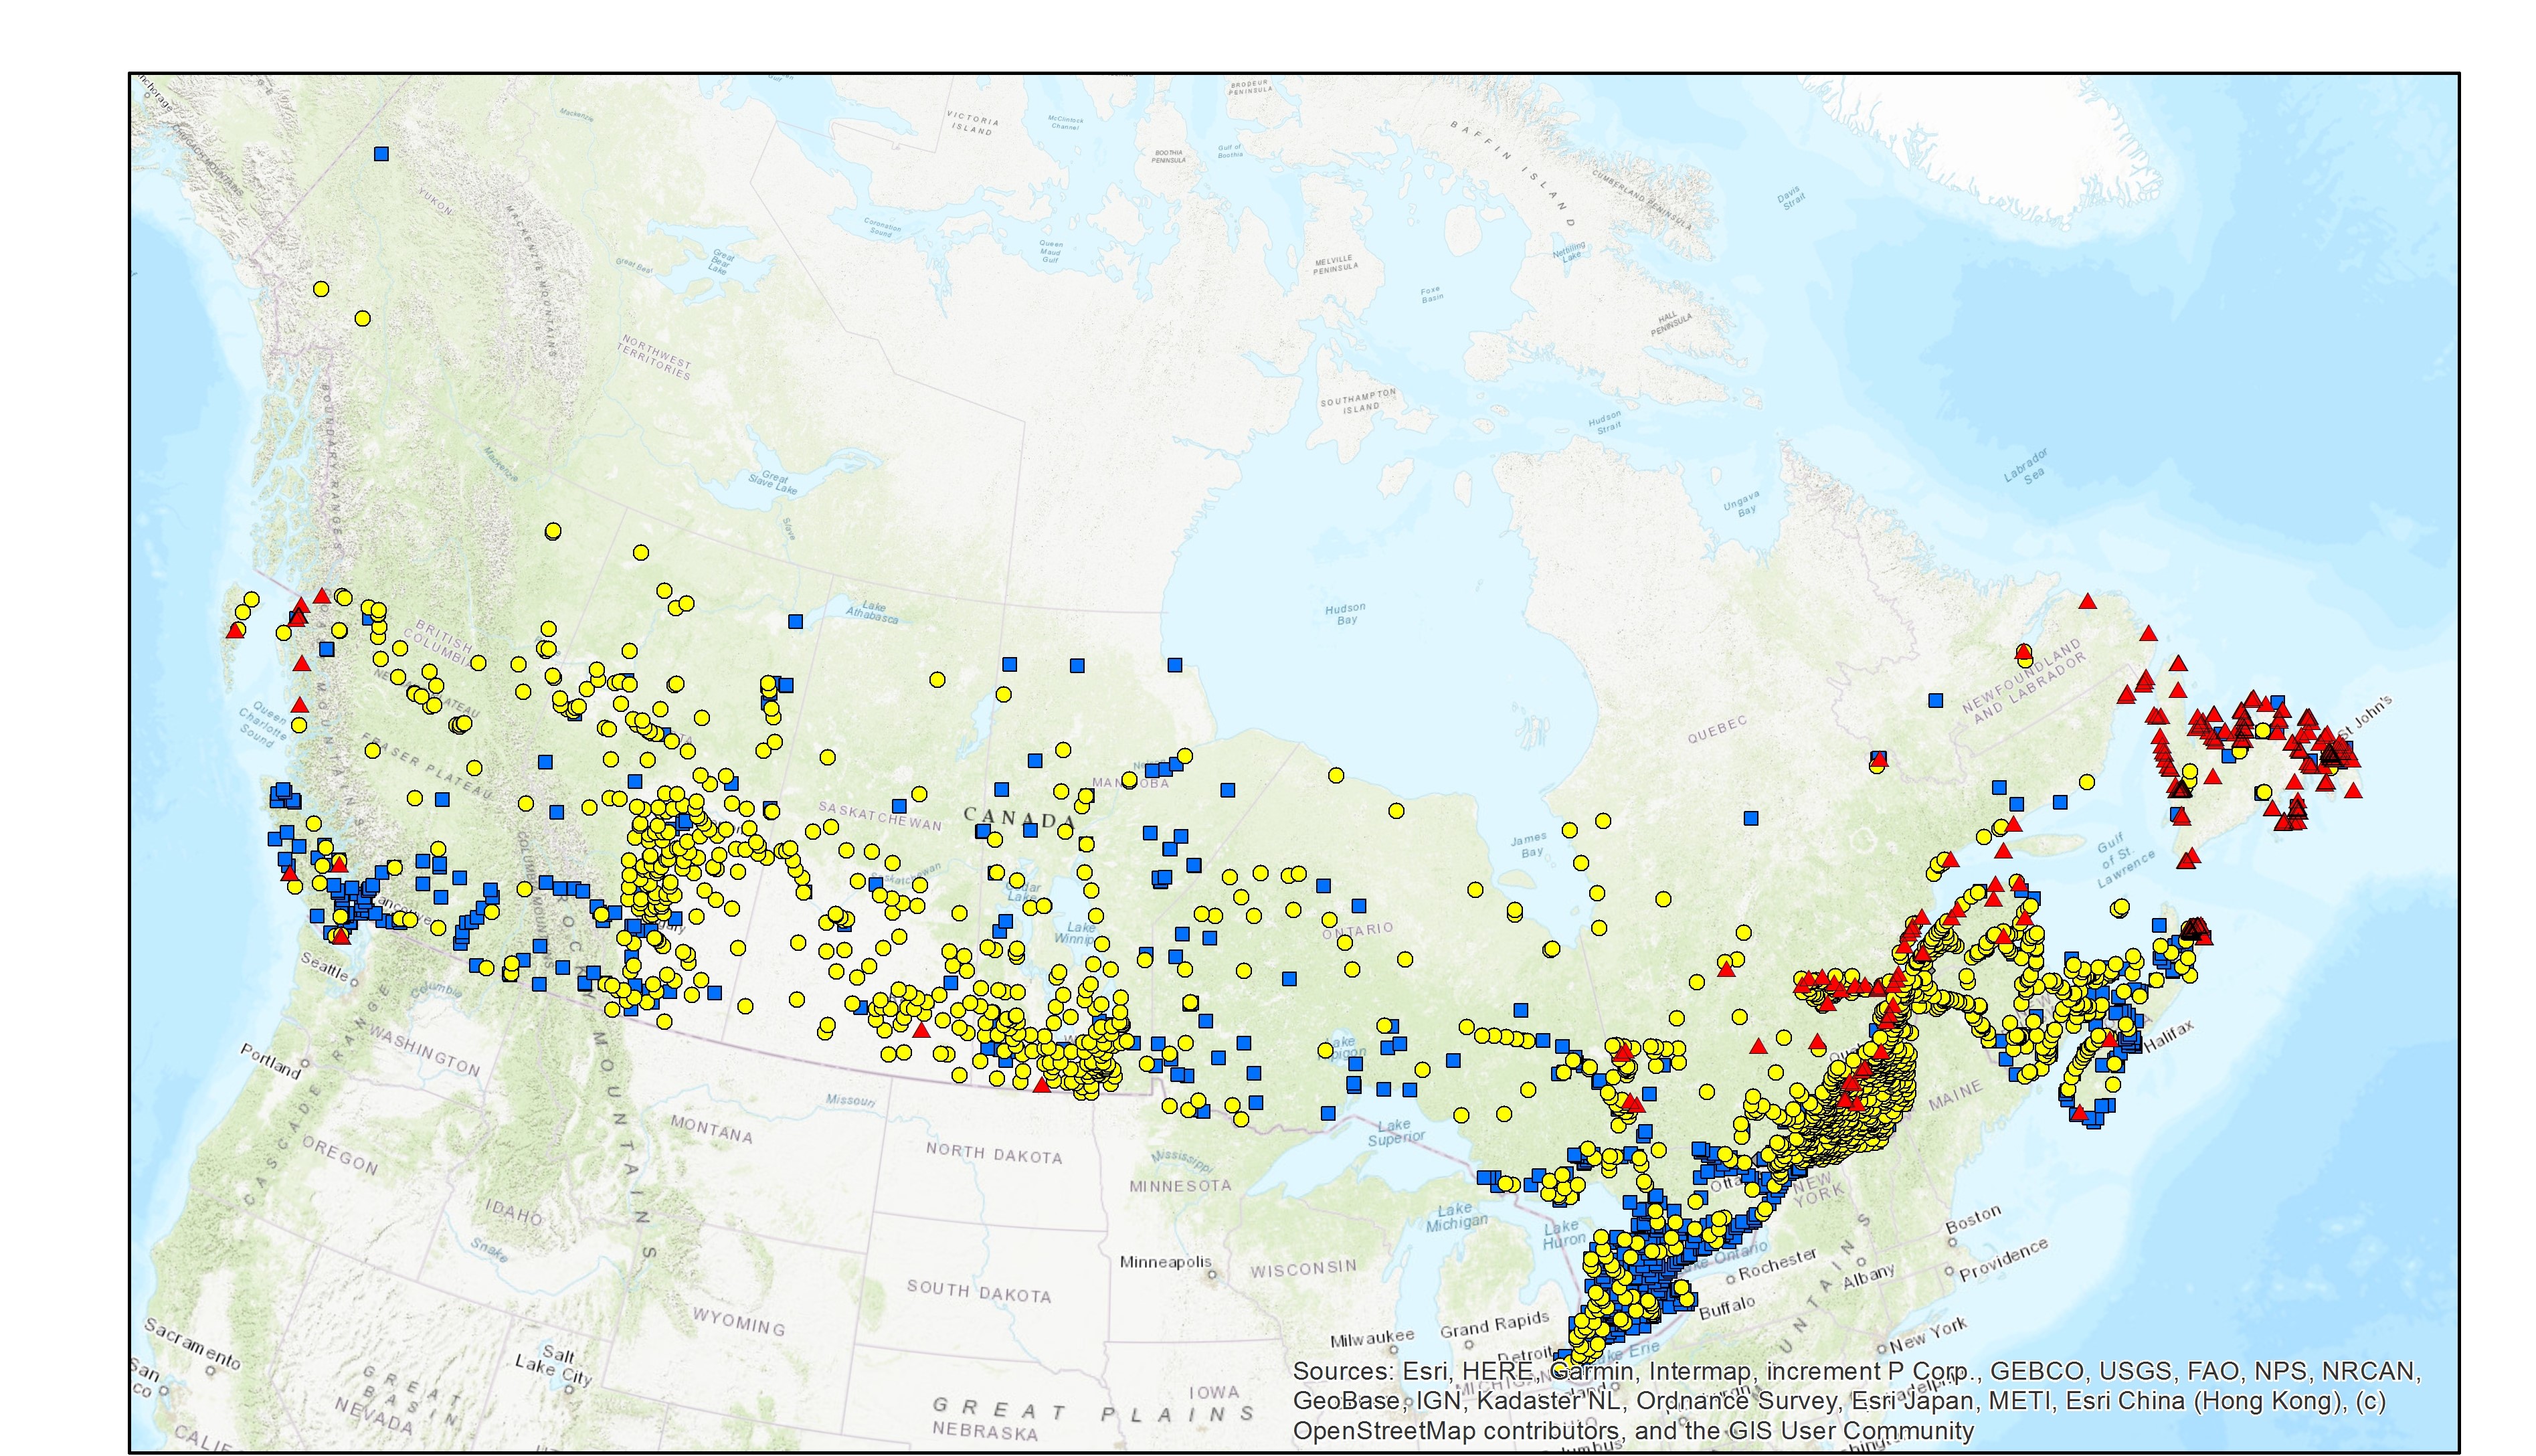
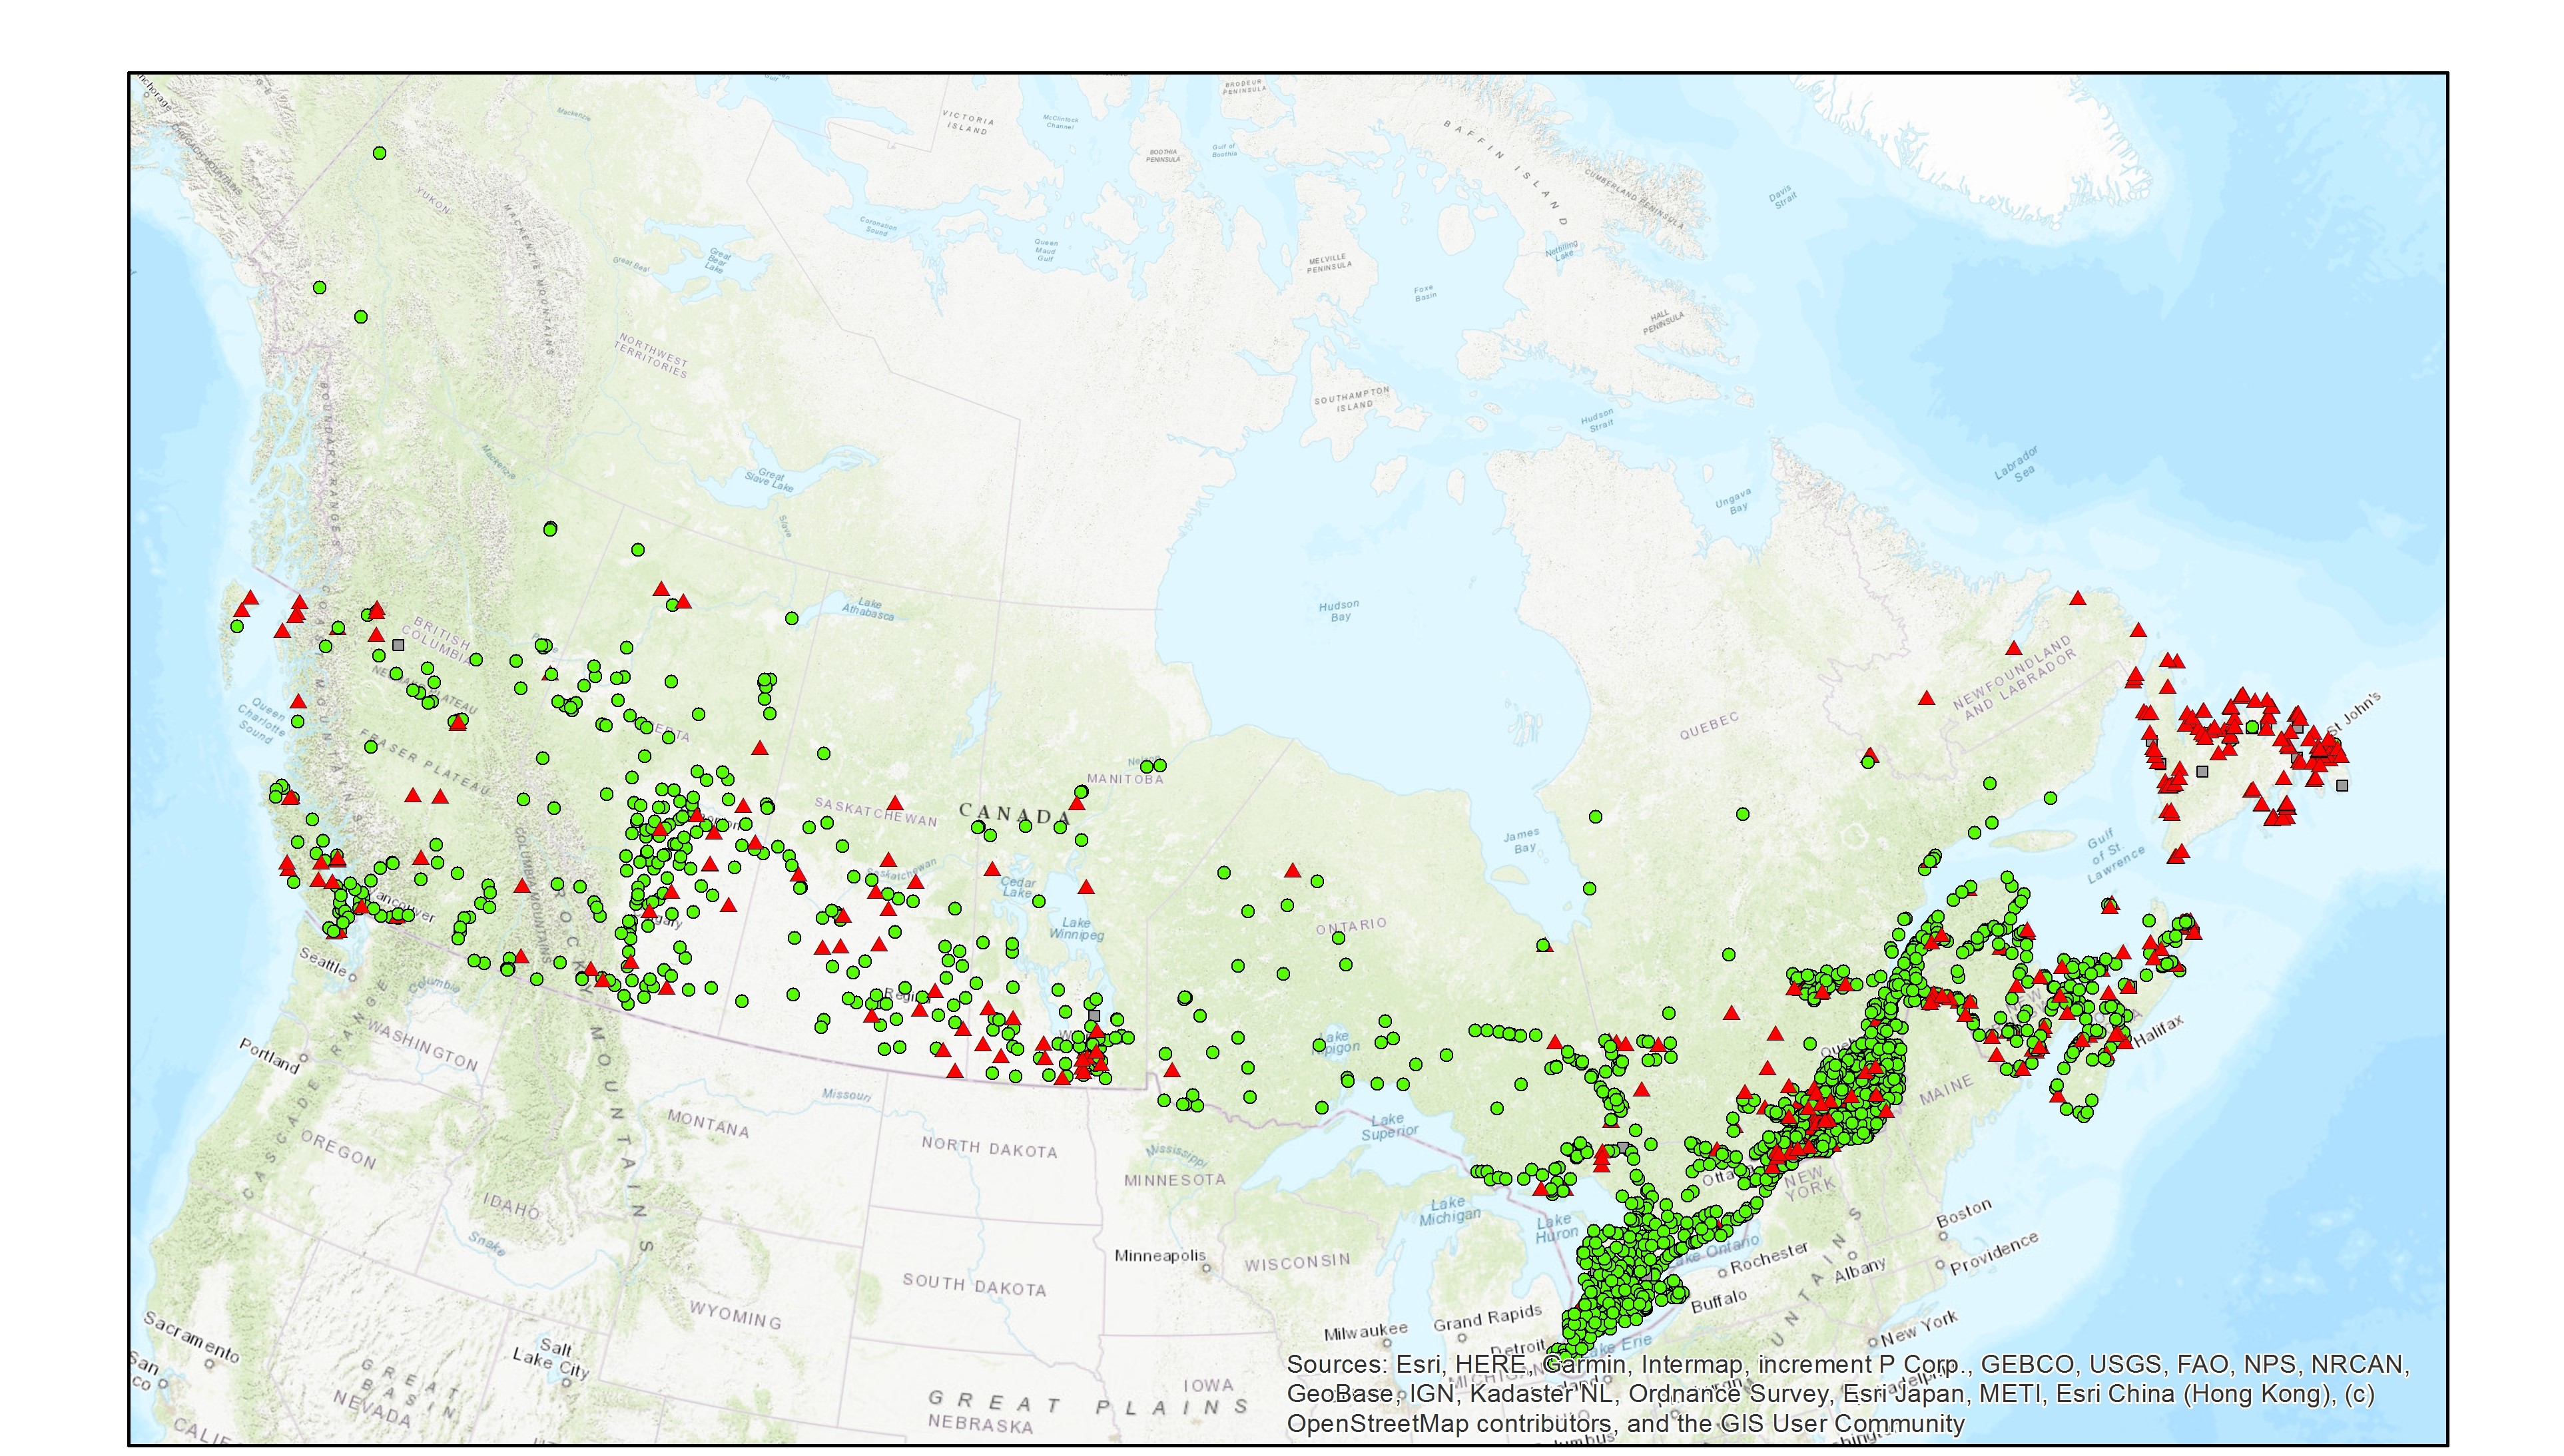
The Wastewater Systems Effluent Regulations (WSER), developed under the Fisheries Act, came into force in 2012 to manage wastewater releases by systems that collect an average daily influent volume of 100 cubic metres or more. The WSER also does not apply to any wastewater system located in the Northwest Territories, Nunavut and north of the 54th parallel in the provinces of Quebec and Newfoundland and Labrador. The WSER set national baseline effluent quality standards that are achievable through secondary wastewater treatment. The map below presents the wastewater system locations in Canada and the type of treatment they utilize (mechanical, lagoon or no treatment). The data is based on the information submitted to Environment and Climate Change Canada as of November 2022. Note that this layer does not represent the level of wastewater treatment or whether the system complies with the WSER. The map is available in both ESRI REST (to use with ARC GIS) and WMS (open source) formats. For more information about the individual reporting wastewater systems, datasets are available in either Excel or CSV formats at the resource listed below: “Wastewater Systems Effluent Regulations Reported Data”. Data from Quebec and Yukon The data for Quebec municipalities (after 2017) is provided to the department separately through the equivalency agreement that was finalized in October 2018. Beginning in 2015, the data reported for the Yukon is provided to the department separately through an equivalency agreement finalized in 2014. More information on the wastewater sector including the regulations, agreements, contacts and resource documents is available at: https://www.canada.ca/wastewater
-
Annual and five-year (5YA) average wet deposition maps for the ammonium ion are available. The file formats include geodatabase files (*.gdb) compatible with geospatial software (e.g. ESRI ArcGIS) and KMZ files compatible with virtual globe software (e.g. Google Earth™). Maps can also be viewed online via Open Maps and the ArcGIS online viewer. Annual deposition from each site was screened for completeness using the following criteria: (1) precipitation amounts were recorded for >90% of the year and >60% of each quarter, and (2) ammonium concentrations were reported for >70% of the precipitation measured over the year and for >60% of each quarter. Five-year average wet deposition values are averaged annual deposition values with a completeness criterion >60% for the five-year period. Units for wet deposition fluxes are in kg of NH4 per hectare per year (kg ha-1 y-1). Sources of measurement data and spatial interpolation method are described here: https://doi.org/10.18164/e8896575-1fb8-4e53-8acd-8579c3c055c2. Recommended citation: Environment and Climate Change Canada, [year published]. NH4 Wet Deposition Maps. Air Quality Research Division, Environment and Climate Change Canada, Toronto, Ontario, Canada. [URL/DOI], accessed [date]. Recommended acknowledgement: The author(s) acknowledge Environment and Climate Change Canada for the provision of Canada-U.S. wet deposition kriging maps accessed from the Government of Canada Open Government Portal at open.canada.ca, and the data providers referenced therein.
-
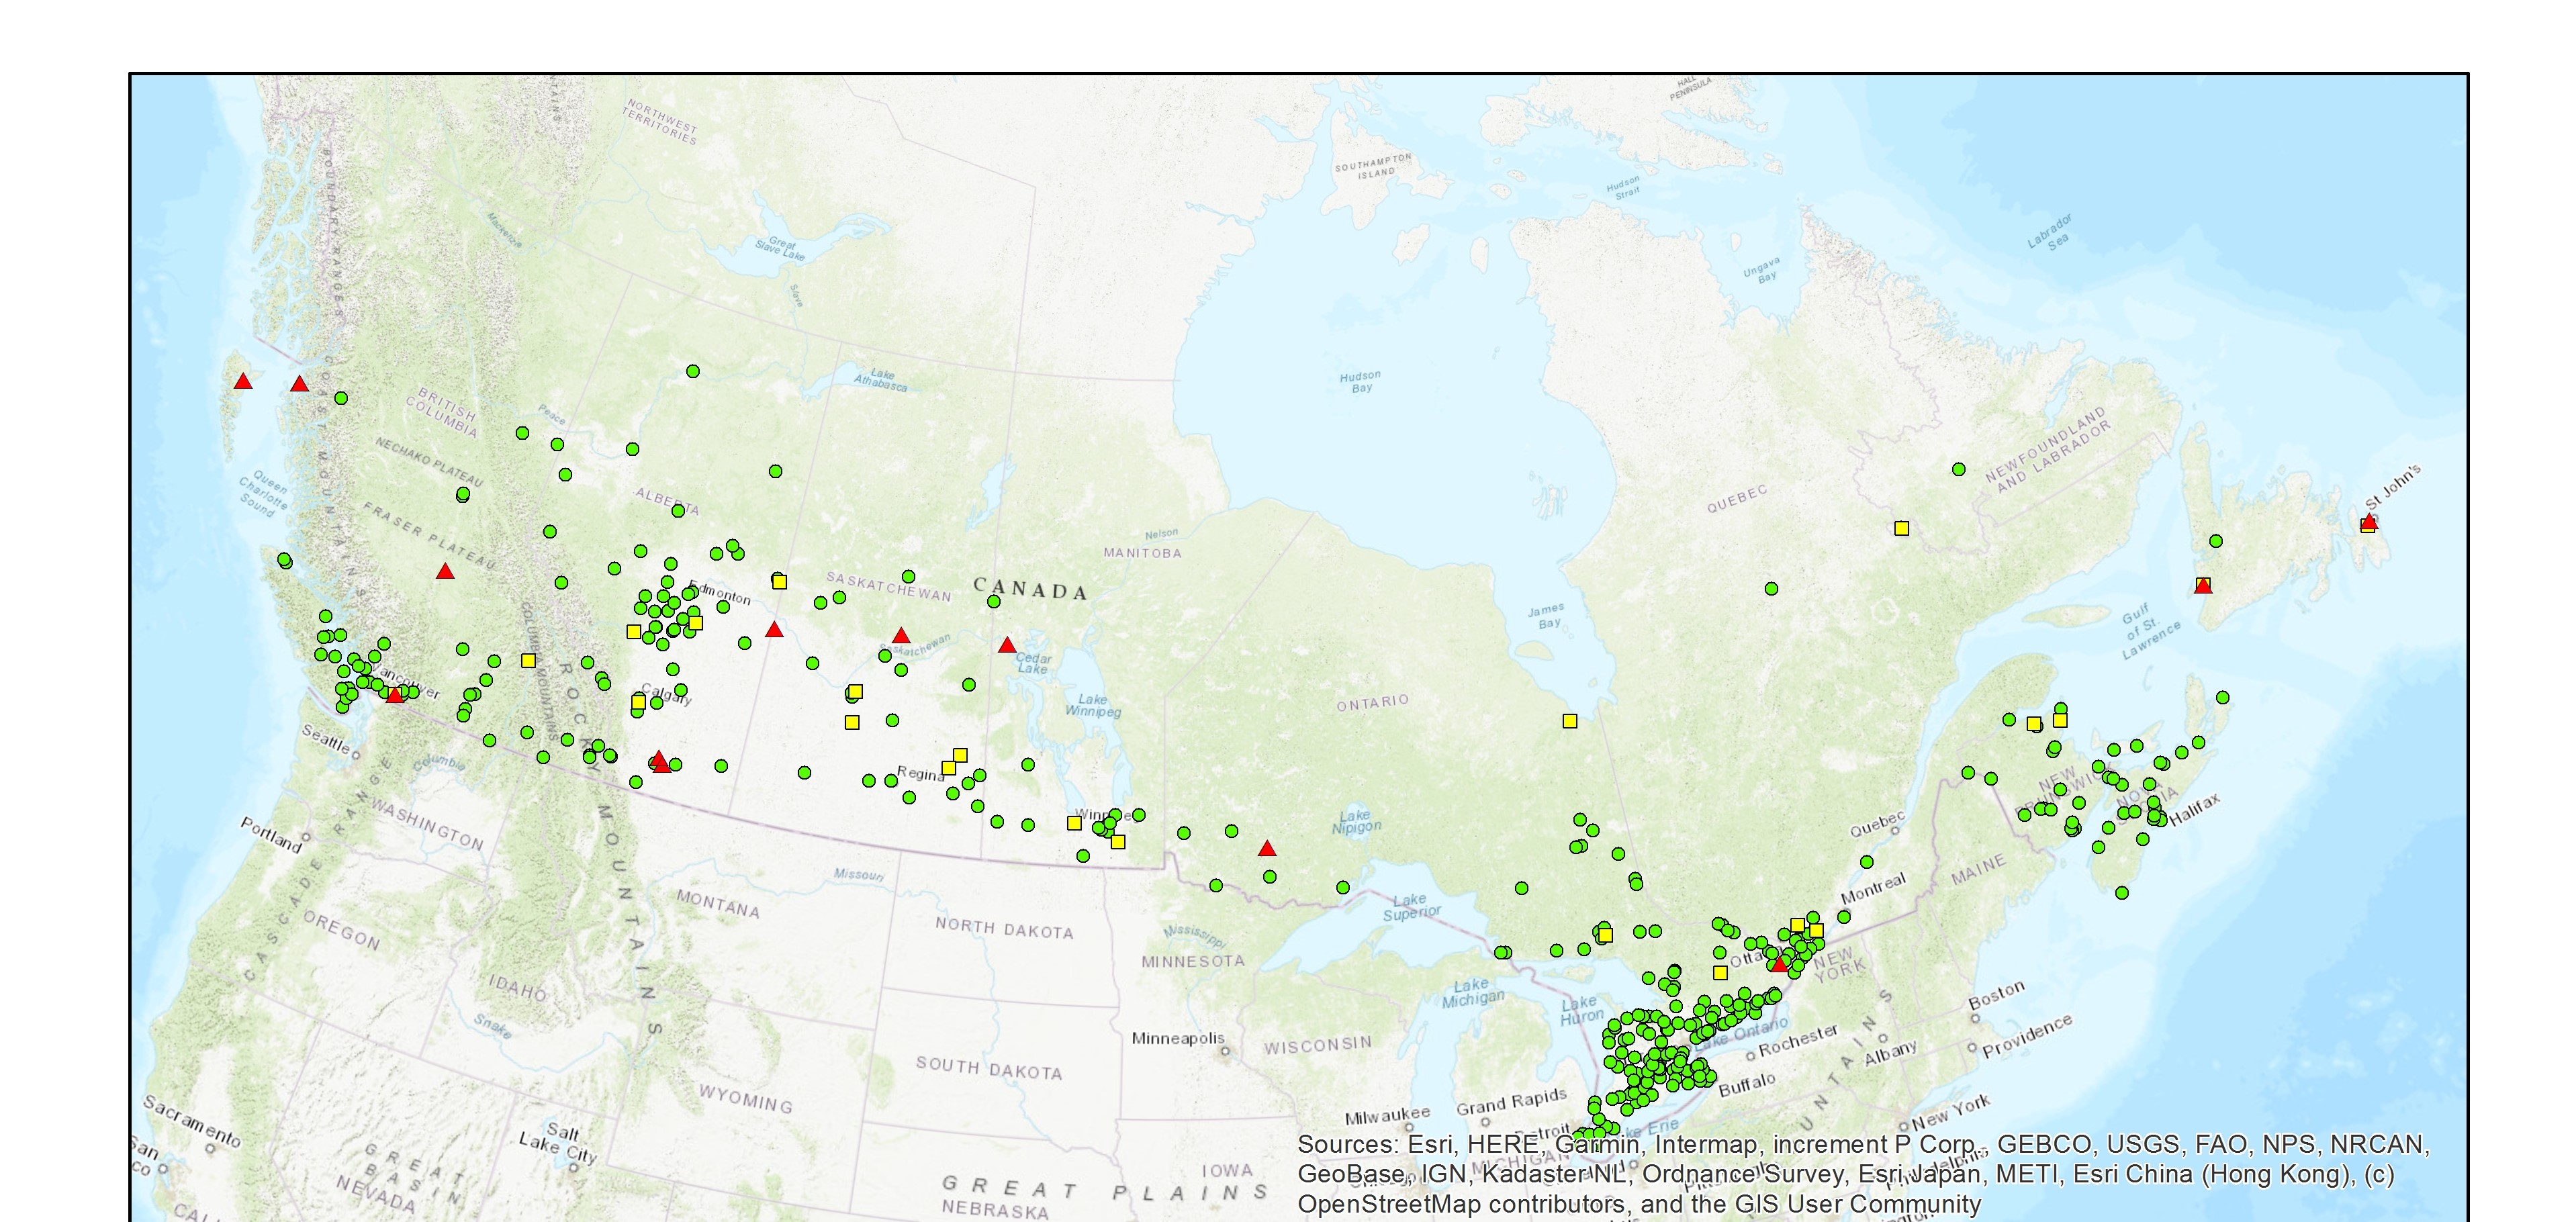
The Wastewater Systems Effluent Regulations (WSER), developed under the Fisheries Act, came into force in 2012 to manage wastewater releases by systems that collect an average daily influent volume of 100 cubic metres or more. The WSER also does not apply to any wastewater system located in the Northwest Territories, Nunavut and north of the 54th parallel in the provinces of Quebec and Newfoundland and Labrador. The WSER set national baseline effluent quality standards that are achievable through secondary wastewater treatment. Under the WSER, owners or operators of wastewater systems discharging annual average daily effluent volumes greater than 2,500 m3 are required to determine and report on the acute lethality of the effluent. The map below presents the percentage of acute lethality test failures for the wastewater systems in Canada that conducted at least one acute lethality test according to the standards of the Wastewater Systems Effluent Regulations. The map is available in both ESRI REST (to use with ARC GIS) and WMS (open source) formats. For more information about the individual reporting wastewater systems, datasets are available in either Excel or CSV formats. Data from Quebec and Yukon As of 2018, no acute lethality results from Quebec municipalities are available since an equivalency agreement is now in effect. As of 2015, no acute lethality test results for wastewater systems in the Yukon are available as an equivalency agreement in is effect. More information on the wastewater sector including the regulations, agreements, contacts and resource documents is available at: https://www.canada.ca/wastewater
-
Annual and five-year (5YA) average wet deposition maps for the nitrate ion are available. The file formats include geodatabase files (*.gdb) compatible with geospatial software (e.g. ESRI ArcGIS) and KMZ files compatible with virtual globe software (e.g. Google Earth™). Maps can also be viewed online via Open Maps and the ArcGIS online viewer. Annual deposition from each site was screened for completeness using the following criteria: (1) precipitation amounts were recorded for >90% of the year and >60% of each quarter, and (2) nitrate concentrations were reported for >70% of the precipitation measured over the year and for >60% of each quarter. Five-year average wet deposition values are averaged annual deposition values with a completeness criterion >60% for the five-year period. Units for wet deposition fluxes are in kg of NO3 per hectare per year (kg ha-1 y-1). Sources of measurement data and spatial interpolation method are described here: https://doi.org/10.18164/e8896575-1fb8-4e53-8acd-8579c3c055c2. Recommended citation: Environment and Climate Change Canada, [year published]. NO3 Wet Deposition Maps. Air Quality Research Division, Environment and Climate Change Canada, Toronto, Ontario, Canada. [URL/DOI], accessed [date]. Recommended acknowledgement: The author(s) acknowledge Environment and Climate Change Canada for the provision of Canada-U.S. wet deposition kriging maps accessed from the Government of Canada Open Government Portal at open.canada.ca, and the data providers referenced therein.
-
The National Pollutant Release Inventory (NPRI) is Canada's public inventory of pollutant releases (to air, water and land), disposals and transfers for recycling. This file is a geodatabase (GDB) that shows the locations of all facilities that reported to the NPRI in the current reporting year. The data are also available in a virtual globe format : https://open.canada.ca/data/en/dataset/d9be6bec-47e5-4835-8d01-d2875a8d67ff Please consult the following resources to enhance your analysis: - Guide on using and Interpreting NPRI Data: https://www.canada.ca/en/environment-climate-change/services/national-pollutant-release-inventory/using-interpreting-data.html - Access additional data from the NPRI, including datasets and mapping products: https://www.canada.ca/en/environment-climate-change/services/national-pollutant-release-inventory/tools-resources-data/exploredata.html